It is not unreasonable for funding bodies of government programs to want hard evidence to justify money they have spent on a program or initiative, or to help them make future decisions relating to where their funds may be directed in the future. Although data and statistics can be powerful tools for these purposes, it is important to know where the limitations of statistics lie. From recent market research and evaluation studies I have conducted for government clients I discovered a number of problems when looking at how others have used statistics. Here are five common problems when using statistics.
Problem 1. Extracting meaning out of little difference
When looking for differences in findings across groups or sub-groups or respondents, there is a skill in being able to isolate and explain whether differences in percentage findings are large enough to be meaningful, or are too small to have any meaning. I am not referring to applying significance tests here, but rather, looking at small percentage differences you know are not significant but wondering if they mean anything. Care needs to be taken not to put too much weight on small differences that have little or no meaning.
Problem 2. Using small sample sizes
When sample sizes are small, caution should be taken when presenting the findings to ensure that the findings are not misleading. For example, let’s consider a survey finding in which 10% of people responded a certain way to a question. If the sample size is 100, that is 10 people. But if the sample size is 30 it is only three. There are a number of other considerations here, such as the quality of the sample and how representative they are of the broader community of interest. But when sample sizes are small, it can be misleading to talk in percentage terms. Raw numbers should be used instead so the reader is clear that the finding relates to just a few people.
Problem 3. Showing meaningless percentages on graphs
Again, this relates to the issue of small sample sizes. I came across this graph recently in a research report:
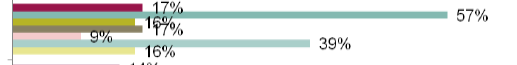
On first glance your eye is drawn to the blue bar showing 57% . It looks like there is something considerable about that group. But when I read the footnote of the report I discovered that the sample size was 4 (sample sizes for the other sub-groups were varied, ranging from 30 to 140). This research company has used a bar chart to illustrate responses of two people from a sample size of four.
Problem 4. Poor survey design
The quality of the statistics are directly related to the quality of the survey from which they came. With online survey tools freely available now, many people are designing their own surveys (poorly) and using subsequently unreliable data to assist with important decision-making. Poor survey design results from a number of things including questions that are ambiguous, leading or confusing. Although the software is dead easy to use, good survey design and subsequent data analysis is a learned skill. Care should be taken to assign this to professionals who know what they are doing.
Problem 5. Scaling and axis manipulation
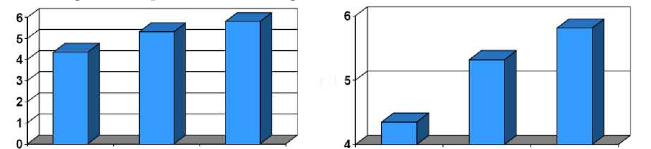
A graph can be altered by changing the scale of the graph. For example, data in the two bar charts in the following figure are identical, but scaling of the Y-axis changes the impression of the magnitude of differences. When designing graphs care should be taken to ensure that the image is not misleading because of the choices you have made in creating the X or Y axis.
There are many more problems with statistics, including bad sampling and choosing the wrong method of survey or interview. If you are commissioning market research be sure to choose a company that understands the principles of basic statistical analysis and good survey design.
If you are a consultant who wishes to use a survey in a study but your are not a trained market research professional, consult an expert for advice. If you are a market research consultant and your client has asked you to draw on findings from someone else’s research, scrutinise it carefully to be sure that it is reliable and meaningful.